Analysis Service
fMRI-Standard Preprocessing
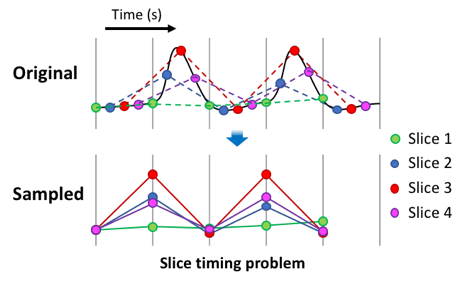
1 Slice timing problem correction
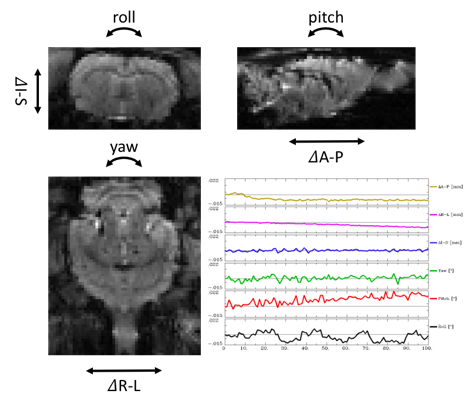
2 Head motion correction
3 Skull stripping
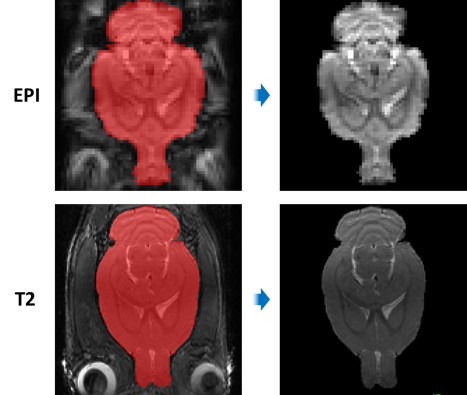
4 Coregistration
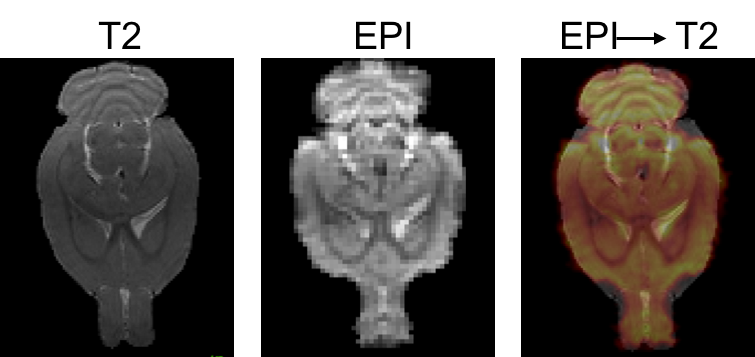
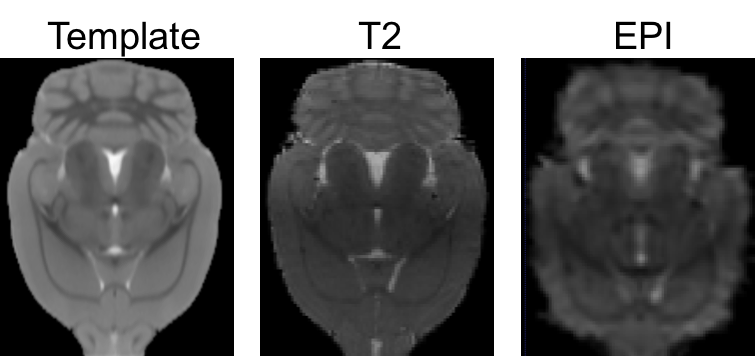
5 Spatial Normalization
fMRI-Evoked
Overview of Pipeline
1
Estimate the task-driven BOLD response model
2
Create subject evoked response map using General Linear Model (GLM) analysis
3
Group-level statistics
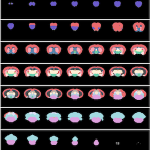
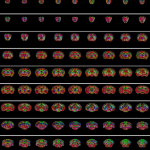
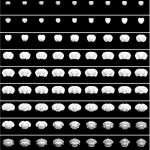
Sample Figures
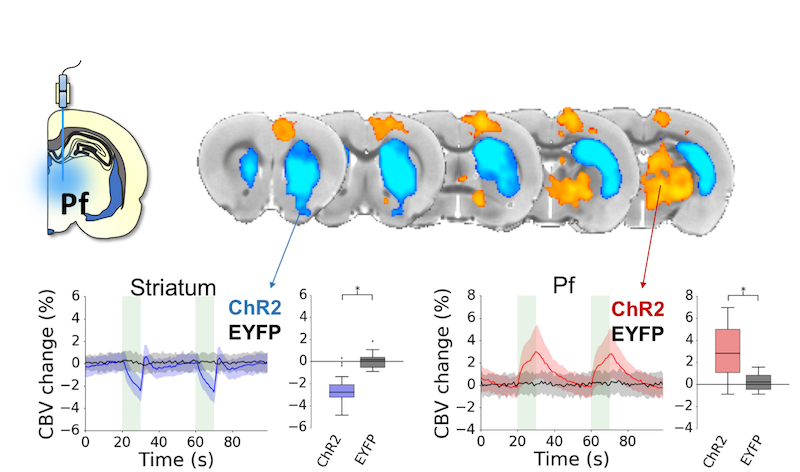
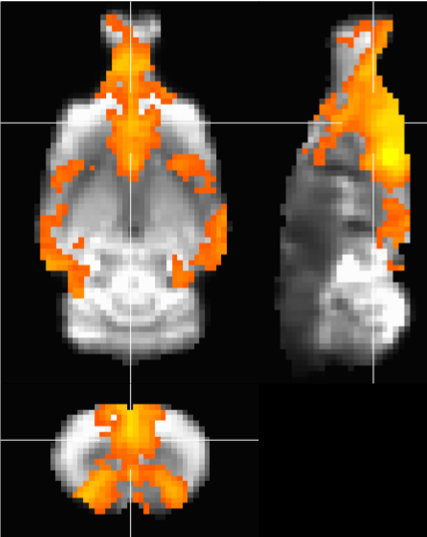
Group evoked response map of optogenetic stimulation on Striatum
fMRI-Resting State
Overview of Pipeline
1
Nuisance signal regression (6 degrees of motion parameter)
2
Frequency filtering (Typical range of band-pass filter: 0.01 ~ 0.1Hz)
3
Calculate resting state parameters: ALFF, ReHo, Seed-based connectivity, etc.
4
Group-level statistics
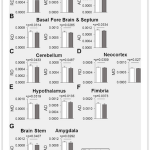
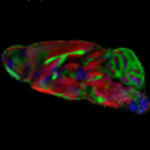
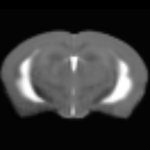
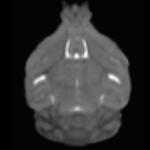
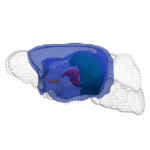
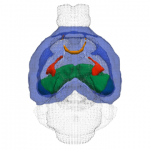
Sample Figures
Seed-based voxel-wise connectivity map from single subject (Wistar rat P80)
Default mode network
Primary Somatosensory
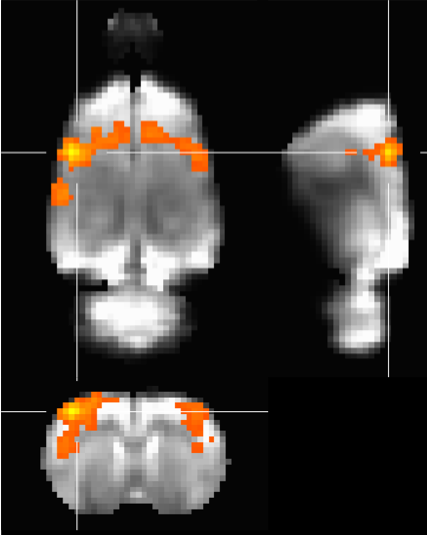
Seed location: CG
Seed location: S1
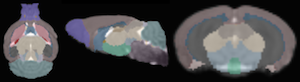
DTI
Overview of Pipeline
1
Rigid Registration
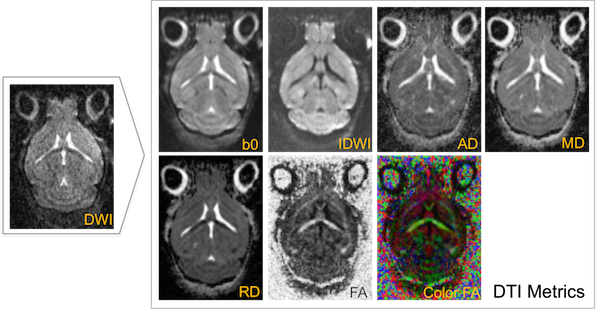
Individual cases are aligned to an external template atlas and the DTI metrics are computed from the raw DWI image
2
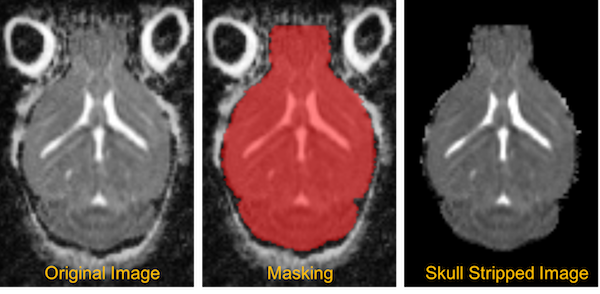
Skull Stripping
All non-brain tissue is removed from the image
3
Population Average Creation
The registered images are averaged together to create an image that is representative of the population of data.
4
Population Average Segmentation
The segmentation from the external template atlas is applied to the population atlas
5
Segmentation Propagation
The segmentation from the population average image is propagated, or warped back to the individual subjects.
6
Region Based Statistics
Both volume and diffusion based-metrics (FA, MD, AD, RD) can be gathered from the indvidual cases’ warped segmentation.
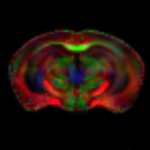
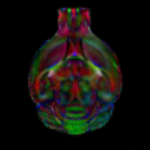
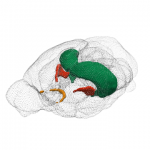
Sample Figures
Average Image of Colored FA
Average Image of MD, AD, RD
3D Images with ROIs
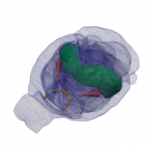
Average Image with 20 ROIs / Bar graphs and correlation plots